Younger or Older?
A Look at Geographic Mobility by Selected Age Groups

Lately, I have seen several posts and articles talking about who is moving where within the United States, particularly during and after the COVID-19 pandemic shock. For today’s number-crunching, I want to contribute to this discussion by looking at geographic mobility of children (under age 18) and seniors (age 65 or older).
The American Community Survey (ACS) asks several questions around geographic mobility and whether the respondent was at the same location (did not move), moved from within the same county, different county but same state, different state, or from abroad compared to the previous year. This data is also available by age groups, income levels, etc. Data for 3,140 counties [1] from the 5-Year ACS ending in 2014 and 2024 was analyzed.
As usual, patterns across county types were analyzed as well. Three county types from the 2013 Rural Urban Continuum Codes (RUCC) calculated by the Economic Research Service (ERS) of the United States Department of Agriculture (USDA) were used: metro, rural adjacent (to metro), and rural non-adjacent (to metro). See map for spatial distribution of these counties.
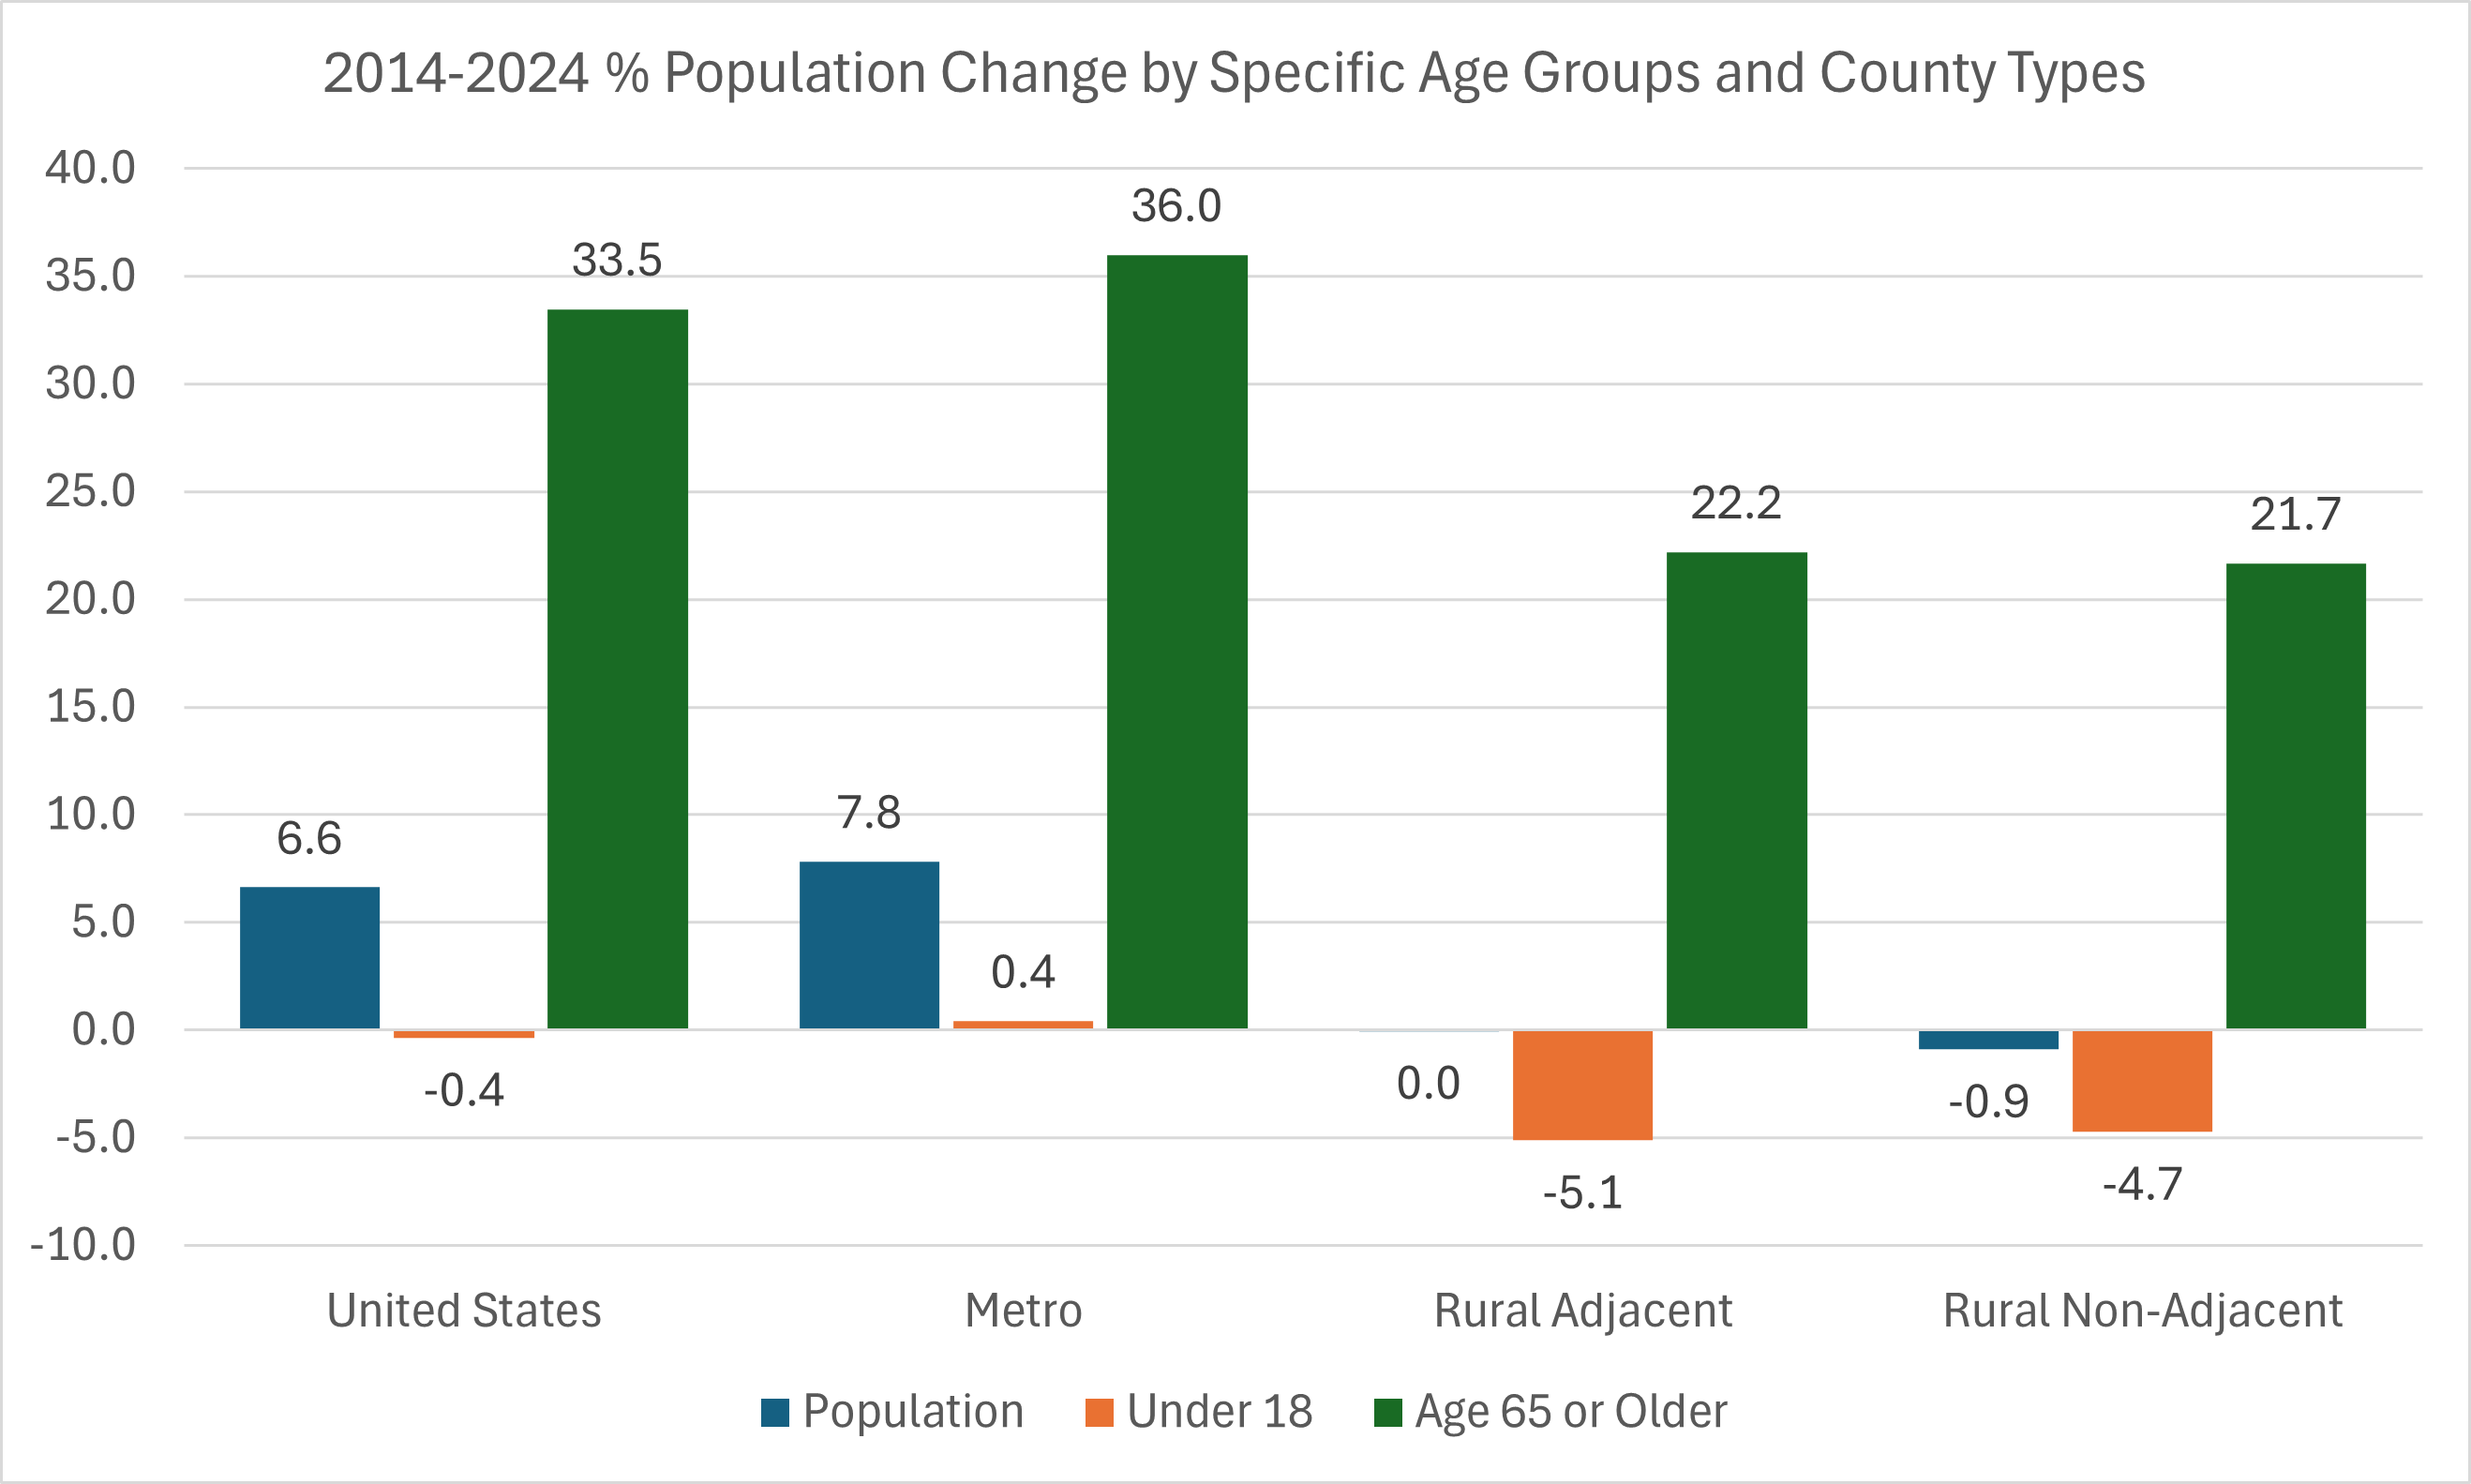
Graph below shows the percentage population change by selected age groups and county types. Overall net population increased in the nation by 20.8 million between 2014 and 2024, driven exclusively by metro counties, which gained 20.9 million. Rural counties—primarily rural non-adjacent—lost close to 150,000 during this period.
Those ages 65 or older increased regardless of county type while children barely increased in metro counties but declined in both rural counties and the nation overall. Those age 65 or older increased by roughly 14.4 million while children decreased by close to 260,000 between 2014 and 2024.
Source: 5-Year ACS
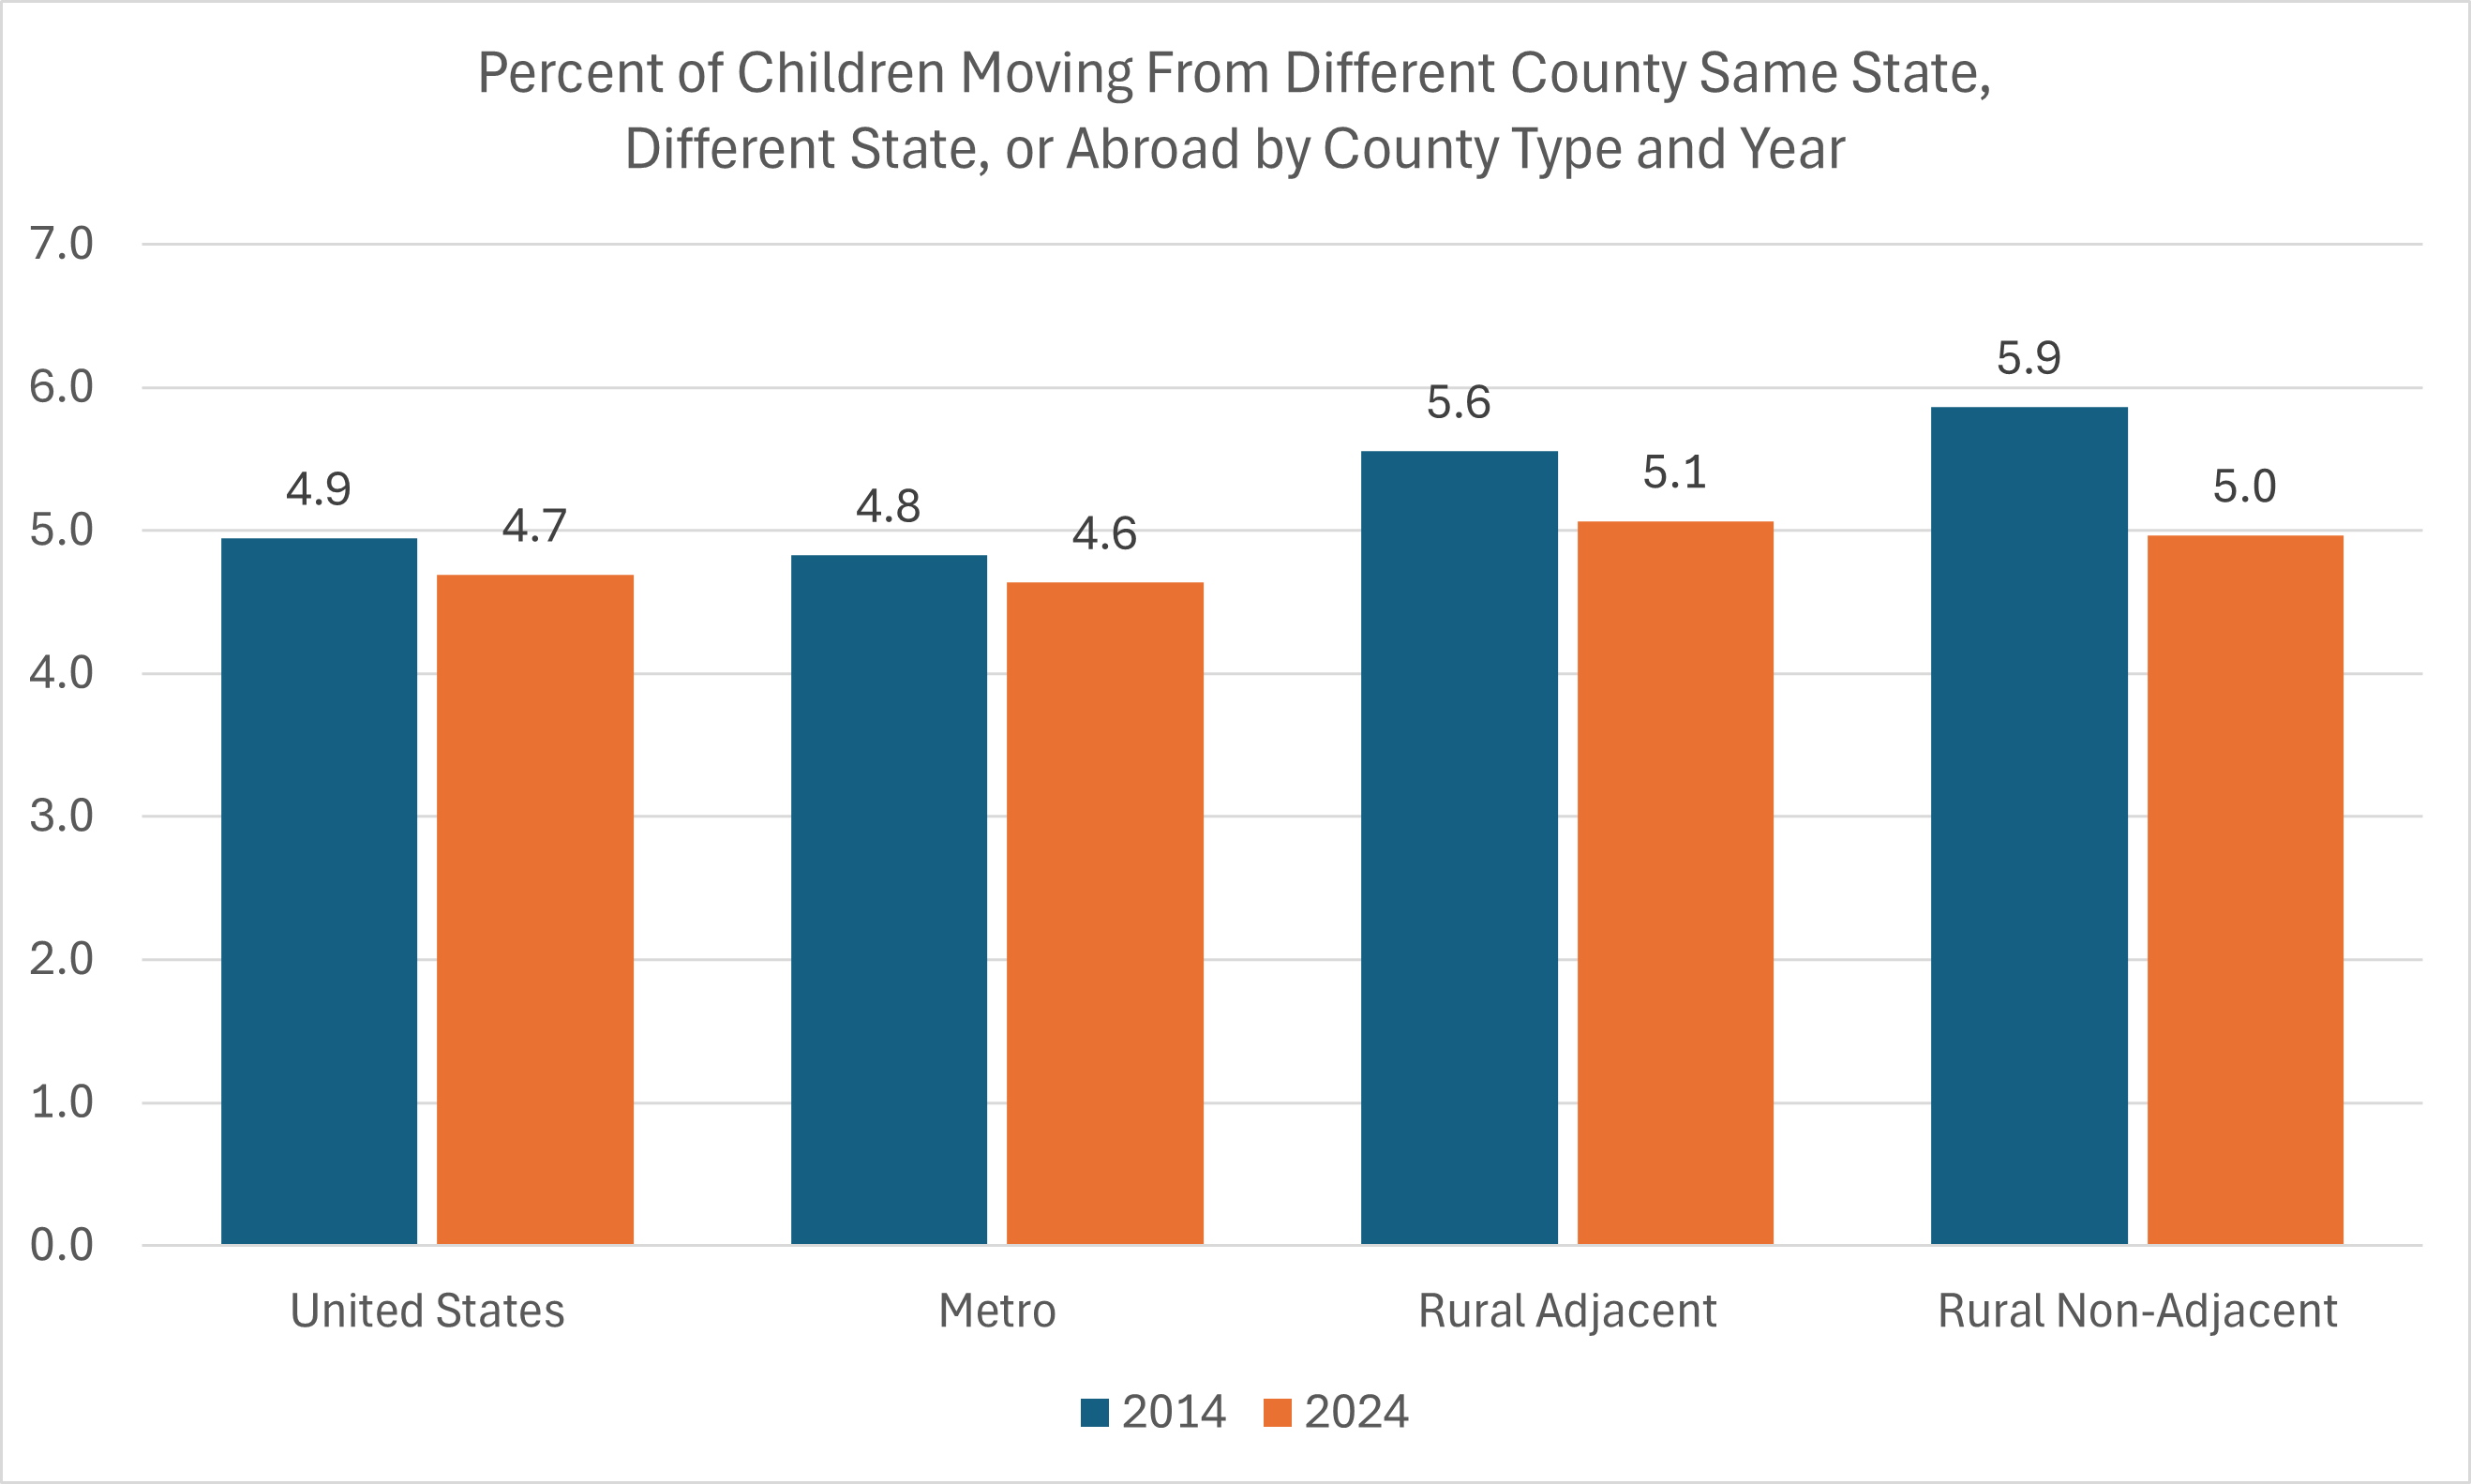
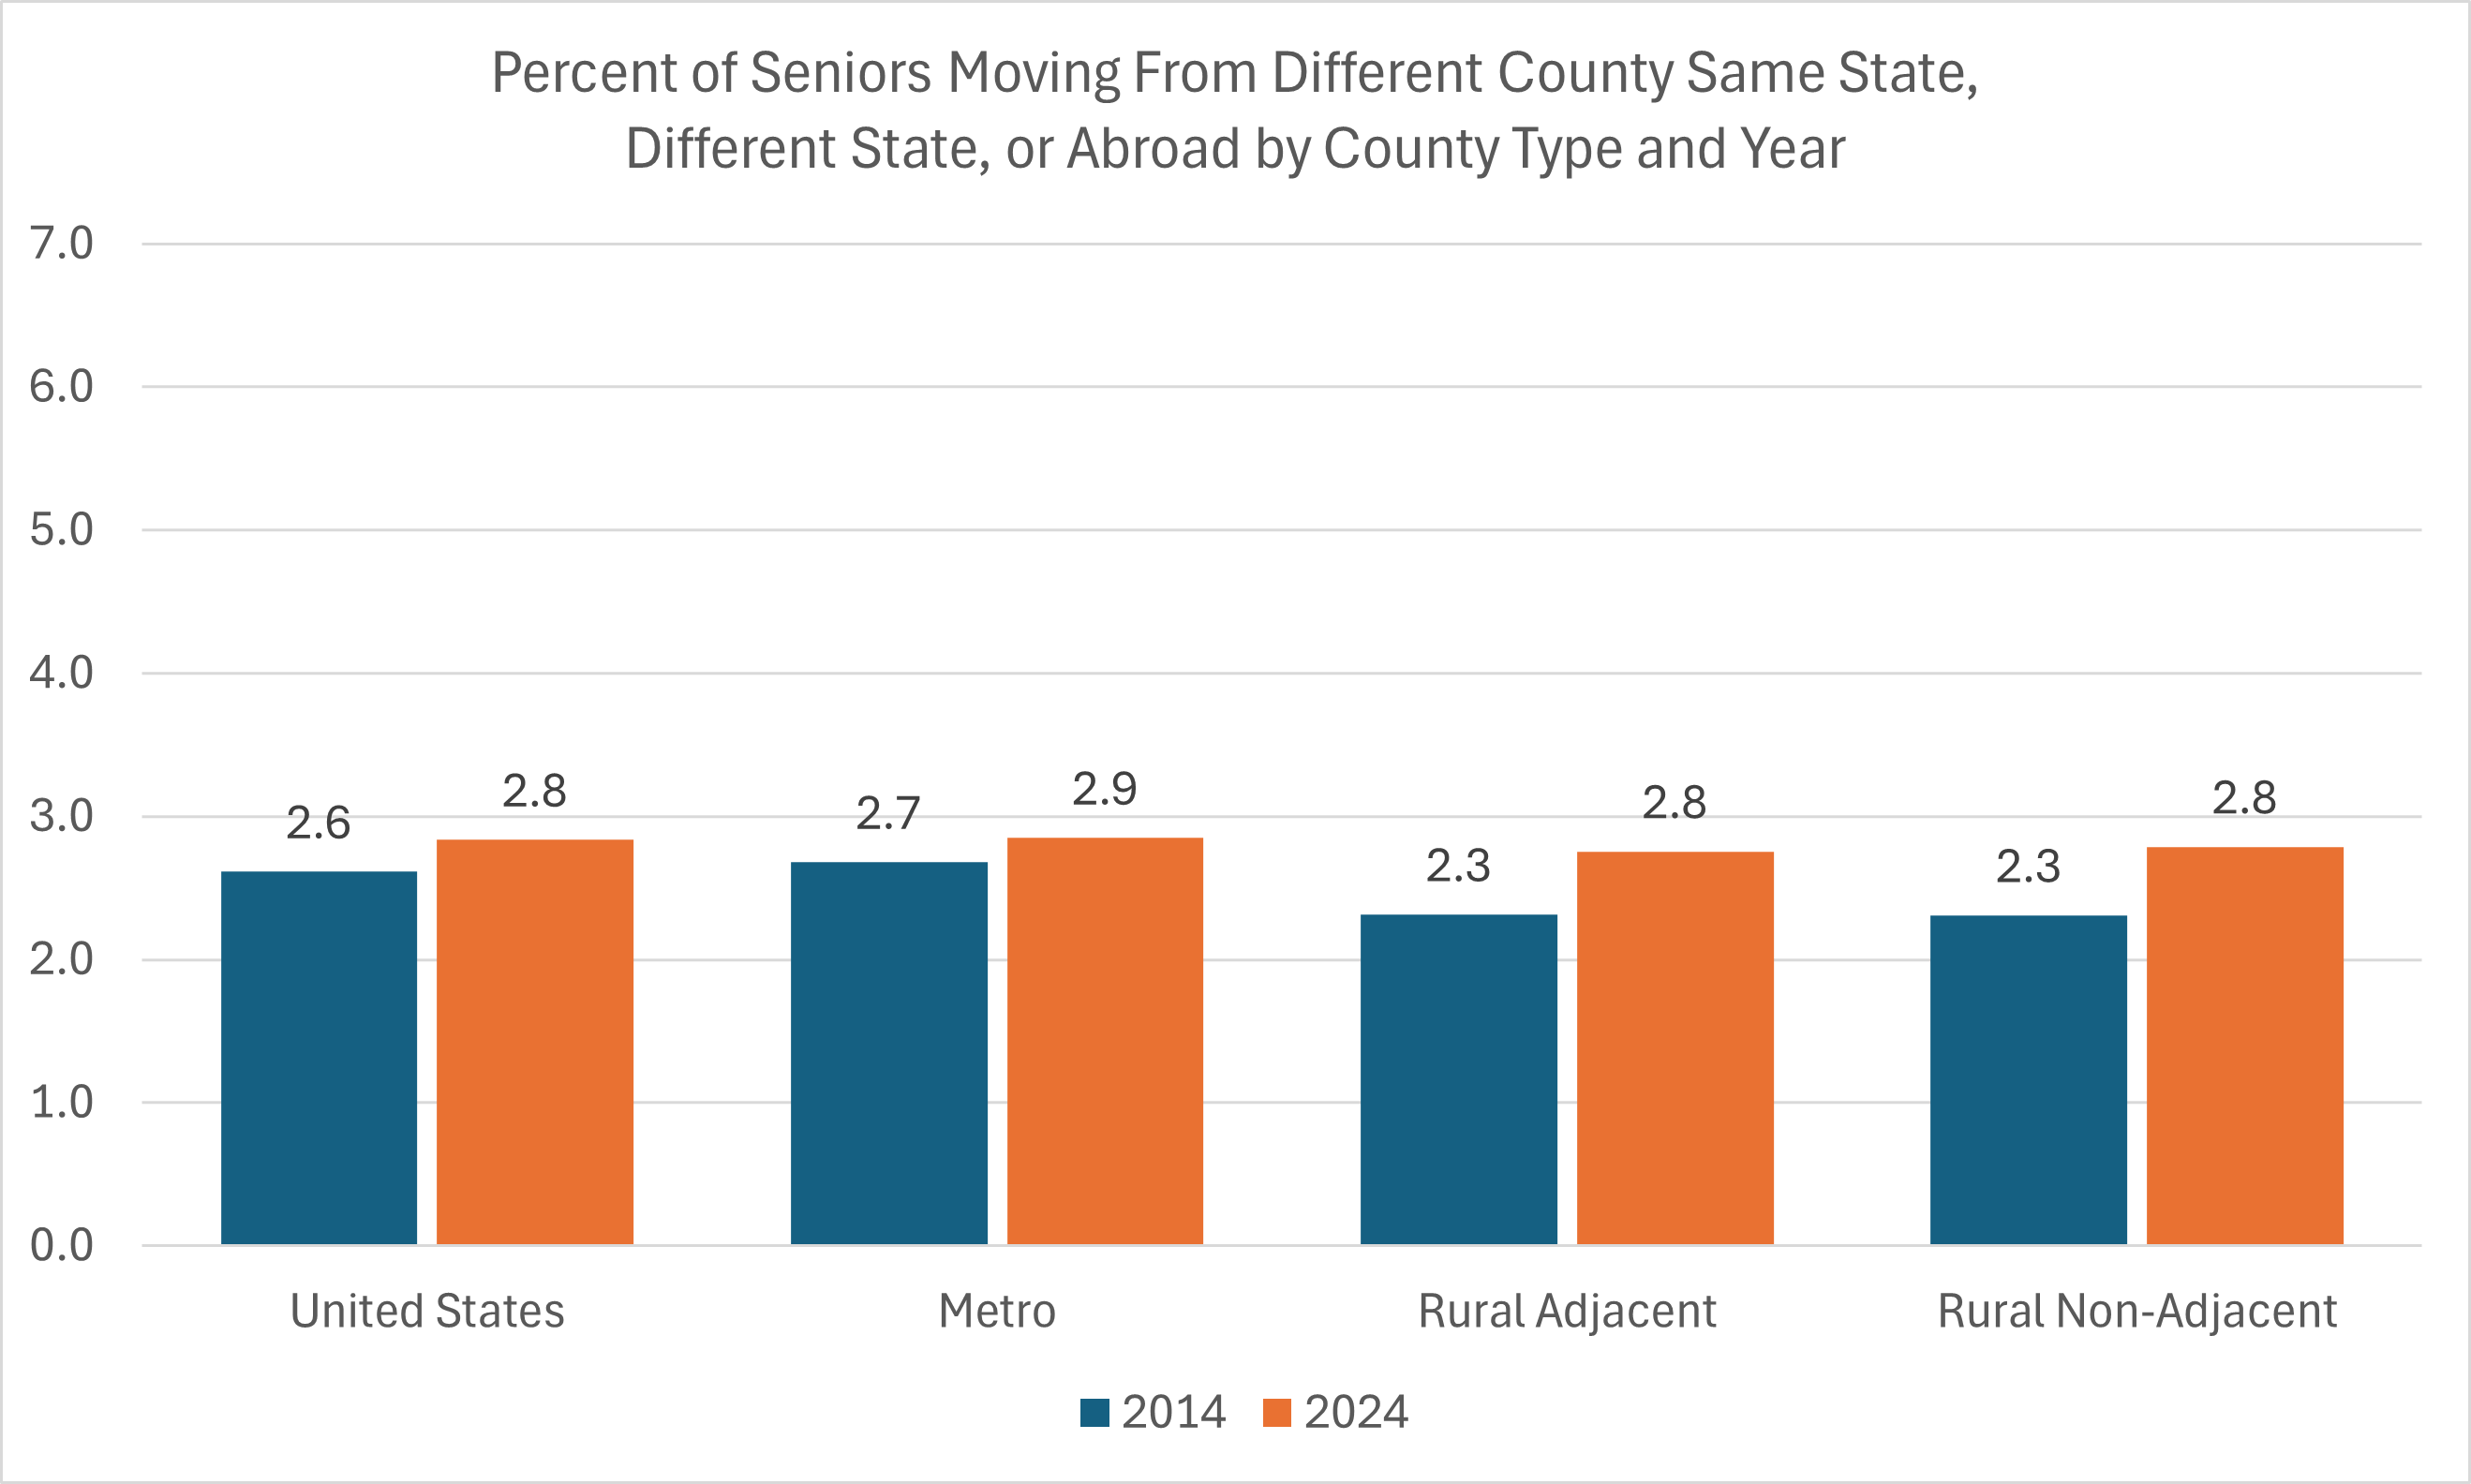
The next two charts show the share of children and seniors that moved from either another county in the same state, a different state, or from abroad by county type and year. The share of children that moved from different counties or abroad declined between 2014 and 2024 across all county types. On the other hand, the share of seniors that moved from different counties or abroad increased during this period across all county types.
Source: 5-Year ACS; USDA RUCC
Where did children and seniors move during this period?
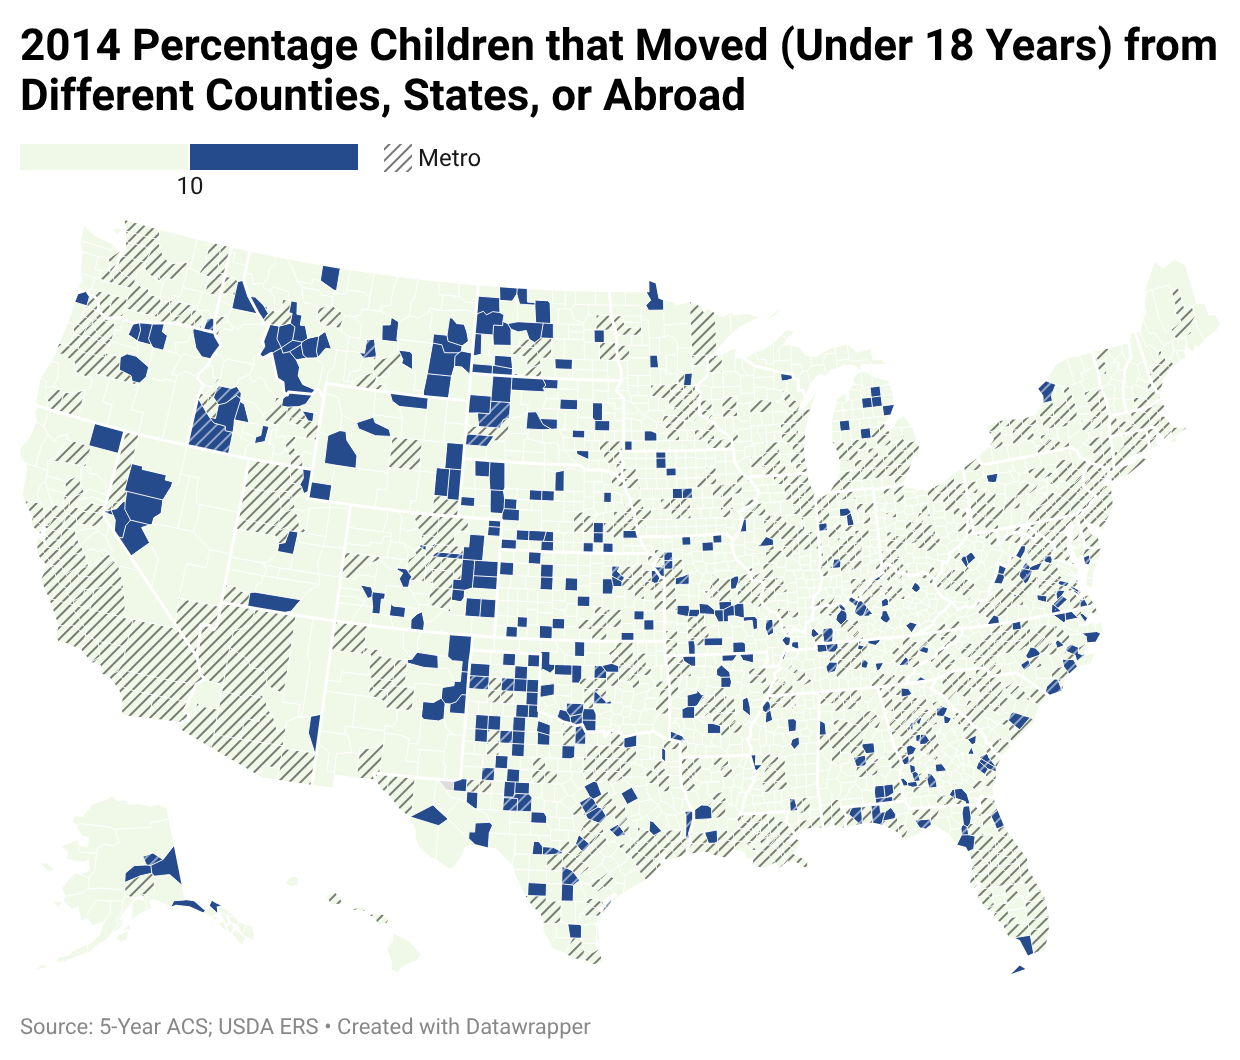
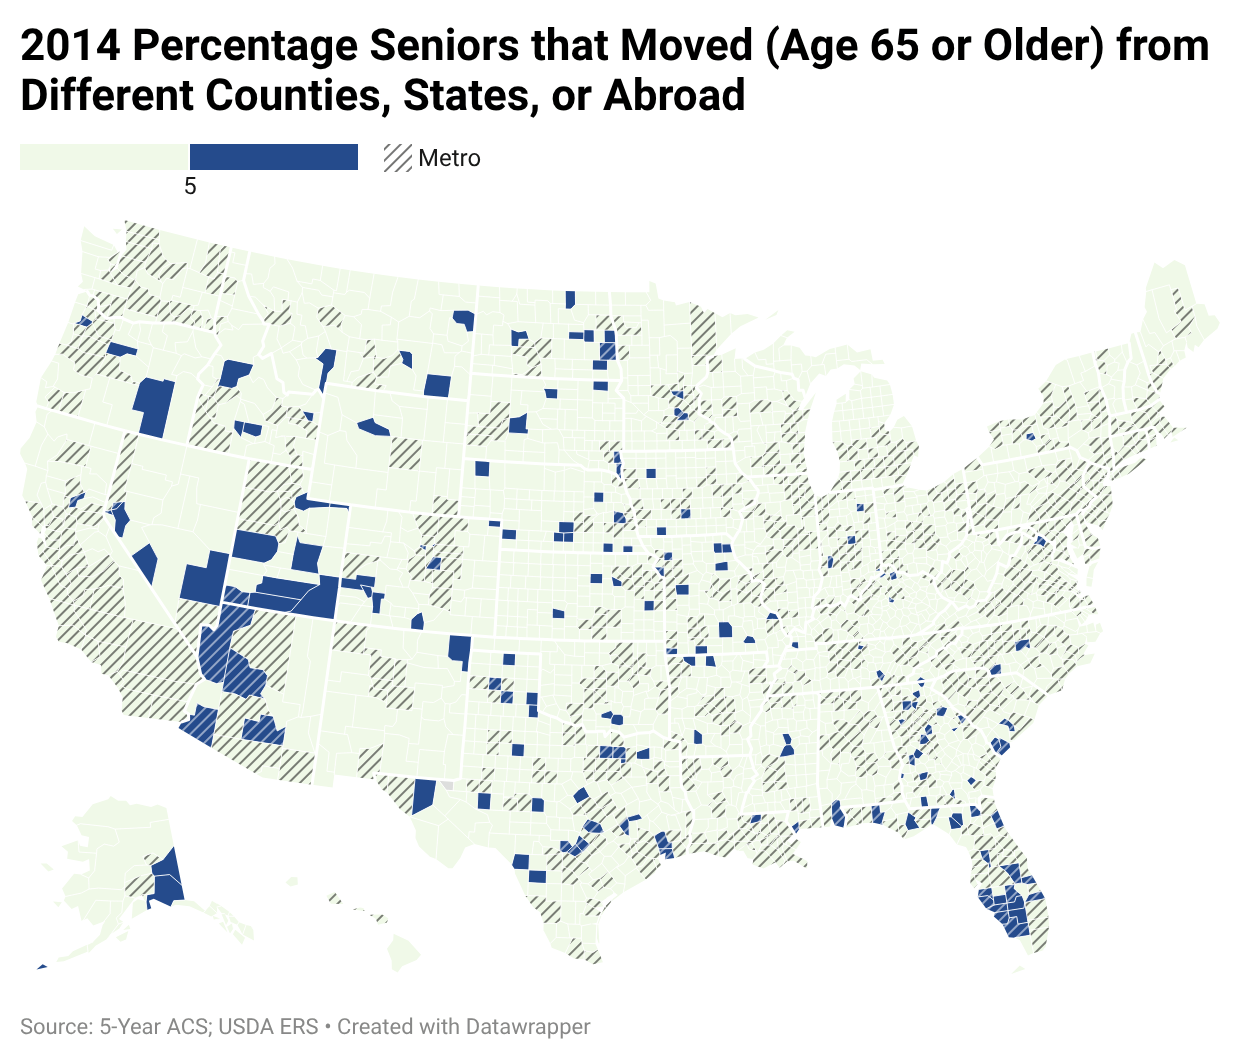
To answer that question, we turn to two animated GIFs showing the counties (dark blue) where the percentage of those moving from different counties or abroad compared to the previous year was 10 percent or higher for those under 18 years (children) and 5 percent or higher for those age 65 or older (seniors), for both 2014 and 2024.
Regarding children, 381 counties in 2014 had 10 percent or higher (dark blue) that moved from a different county, state, or abroad, totaling 252,800. By 2024, the number of counties declined to 269 totaling 166,200 children.
Regarding seniors or those age 65 or older, 182 counties in 2014 had 5 percent or higher (dark blue) that moved from a different county, state, or abroad, totaling 116,300. By 2024, the number of counties increased to 265 totaling 201,000 seniors.
Finally, we looked at states as well. The top 5 states whose number of children moving from other states and abroad increased the most between 2014 and 2024 were: Florida, Texas, New Jersey, North Carolina, and Idaho. The top 5 states whose number of seniors moving from other states and abroad increased the most between 2014 and 2024 were: Florida, Texas, North Carolina, Arizona, and South Carolina.
In Florida, the number of children moving from another state or abroad increased by 22,600 while increasing 17,086 in Texas between 2014 and 2024. Regarding seniors, the increase was 37,477 in Florida and 20,568 in Texas. This comes as no surprise since these two states also had the largest total population increase between 2014 and 2024 with 4 million and 3 million, respectively.
Data Whispers
The geographic mobility data tells a story of two Americas diverging by age. Between 2014 and 2024, the senior population (65+) grew by 14.4 million regardless of county type, and the share of seniors moving across county or state lines increased everywhere — more older Americans are relocating, and to a wider range of places. Children, by contrast, declined nationally by about 260,000, with losses concentrated in both rural county types, and the share of children moving from different counties or abroad dropped across the board.
The number of high-mobility counties for children (those where 10% or more moved from a different county or abroad) fell from 381 to 269, while the equivalent count for seniors (at the 5% threshold) grew from 182 to 265. In other words, children are becoming less mobile and fewer in number while seniors are becoming more mobile and more numerous.
Places that are already growing are attracting both families and retirees, while places that are shrinking are losing their youngest residents and gaining only modest numbers of older ones — a demographic feedback loop that, left unaddressed, will widen the gap between thriving and struggling communities.
[1] Kalawao, HI and Loving, TX were not included to minimize outliers since their total population was less than 100.