The Working Age, the Future Talent Pipeline, and Retirement Age Groups
Specific race/ethnic groups are driving these changes
A recent analysis by the Brookings Institution found that population growth between July 2023 and July 2024 was driven mostly by immigration (defined by specific racial/ethnic groups) among those younger than 18 years. This analysis sheds light on the future talent pipeline of the U.S. economy.
So, given the known curiosity of yours truly, the Data Whisperer, as well as that of our readers, today’s number crunching looks at changes in the working age population (ages 15 to 64) and those under age 15 (future talent pipeline) between 2013 and 2023 by race/ethnicity Census categories. We also looked at those aged 65 or older, given their contributions to the labor force as well as their communities. Data was obtained from the U.S. Census Population Estimates.
These data whispers will help inform community leaders and policymakers about changes in their working-age population as well as their future talent pipeline and retirement community.
For this data crunching, the latest (2023) Rural Urban Continuum Codes from the United States Department of Agriculture (USDA) Economic Research Service (ERS) were used. This typology breaks counties into nine types based on their degree of urbanization, adjacency to a metro area, and economic ties measured by labor-force commuting.
In other words, if your county has a small population and has a rural feel to it, and yet is labeled metro, it is due to being adjacent to a metro county and/or labor force ties to a nearby metro county. So please, don’t shoot the messenger! Counties were further grouped into metro/urban, rural adjacent (to a metro county), and rural non-adjacent (to a metro county). The interactive figure below shows U.S. counties by their RUCC type (hover over a county for more information).
The race/ethnicity mutually exclusive categories analyzed included: White non-Hispanic, Black non-Hispanic, Asian non-Hispanic, Hispanic or Latino, American Indian or Alaska Native, Native Hawaiian and Other Pacific Islander, and Two or More Races non-Hispanic.
Before we jump into the working age population, the future talent pipeline age group (age under 15), and those aged 65 or older, let’s look at the total population. According to the 5-year ACS, the total population in the U.S. went from 315.9 million in 2013 to 336.8 million in 2023, an increase of roughly 20.8 million. Most of this growth took place in metro counties, which gained 20.7 million, while rural adjacent counties gained about 170,000, and rural non-adjacent counties lost about 123,000.
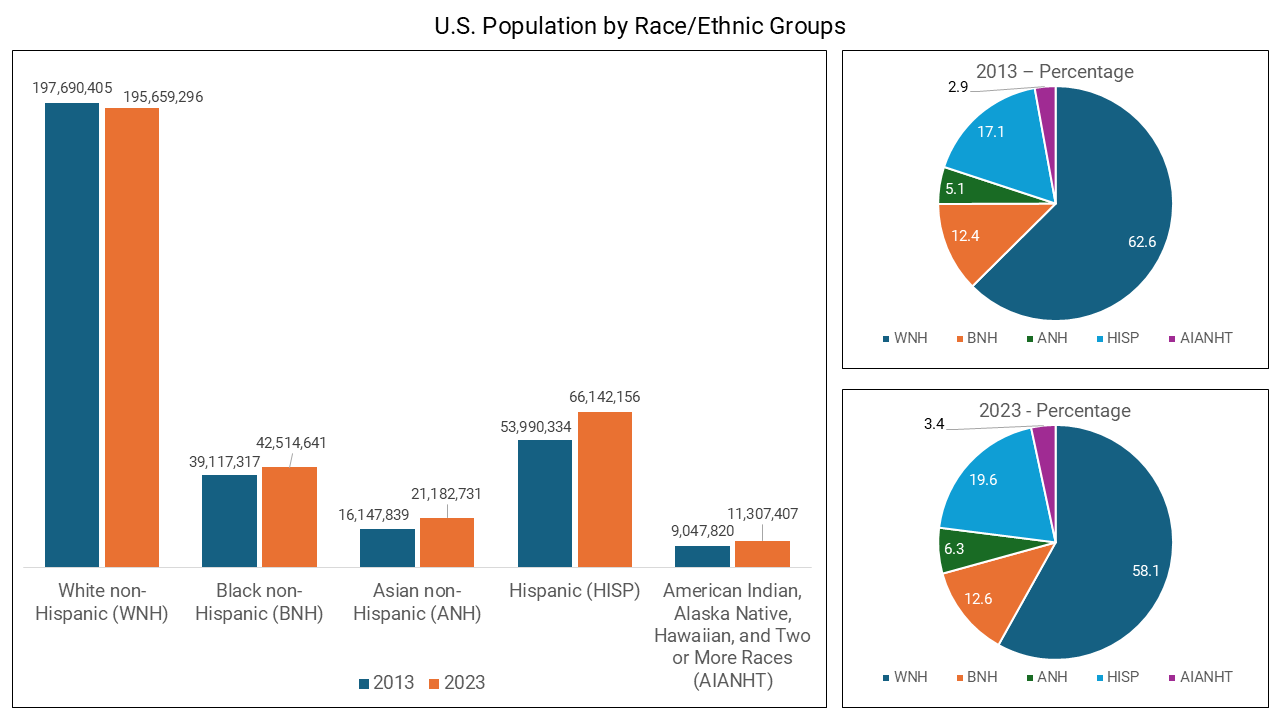
The figure below shows which racial/ethnic groups increased or decreased, contributing to this population growth. All growth between 2013 and 2023 took place among minorities, which increased collectively by 22.8 million while the White non-Hispanic population declined by 2 million, resulting in a net increase of 20.8 million (see bars). As a share of the total population, White non-Hispanic decreased from almost 63% in 2013 to a little more than 58% in 2023 (see pie charts).
Source: Author’s Calculations; U.S. Census Bureau Population Estimates
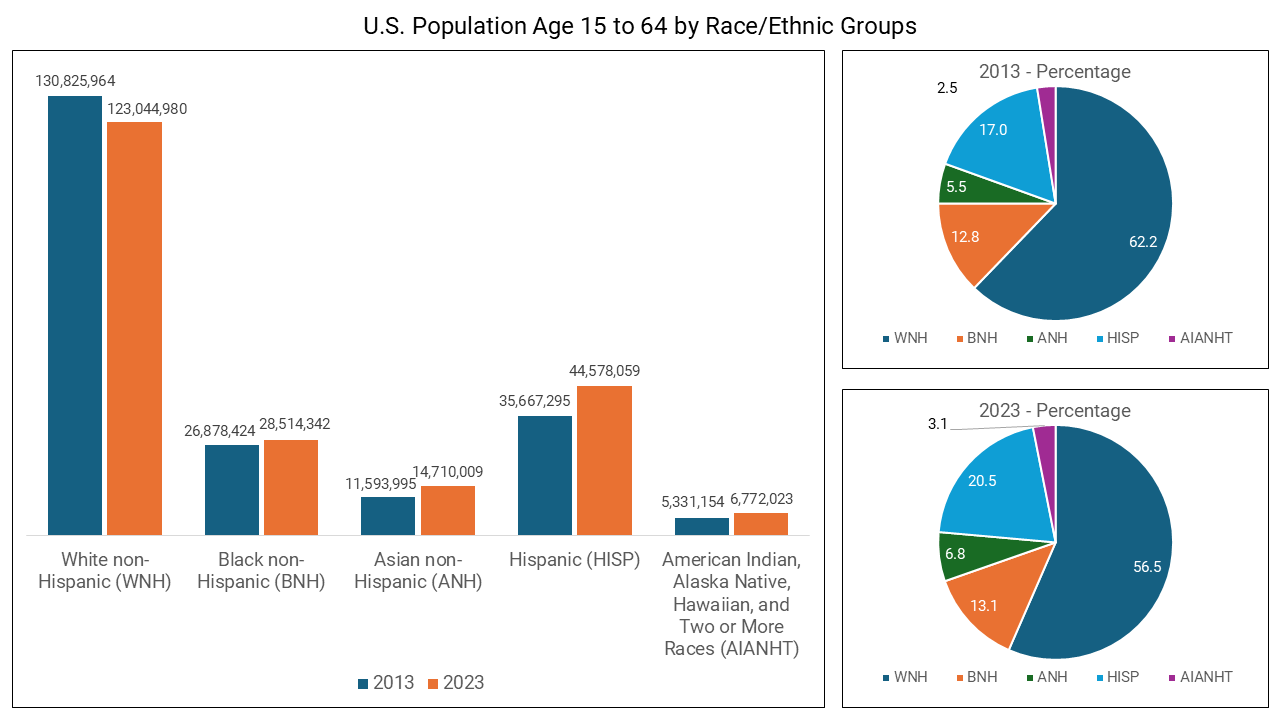
Looking at the change in the working-age population (ages 15 to 64) during the same period, the figure below shows that, in this case, too, all growth took place among minorities. The White non-Hispanic working-age population declined by 7.7 million (from 130 million to 123 million) while minorities increased by 15.1 million. This resulted in a net increase of 7.3 million among this group. As a percentage, the share of White non-Hispanic among this age group decreased from 62.6% in 2013 to 56.5% in 2023.
Source: Author’s Calculations; U.S. Census Bureau Population Estimates
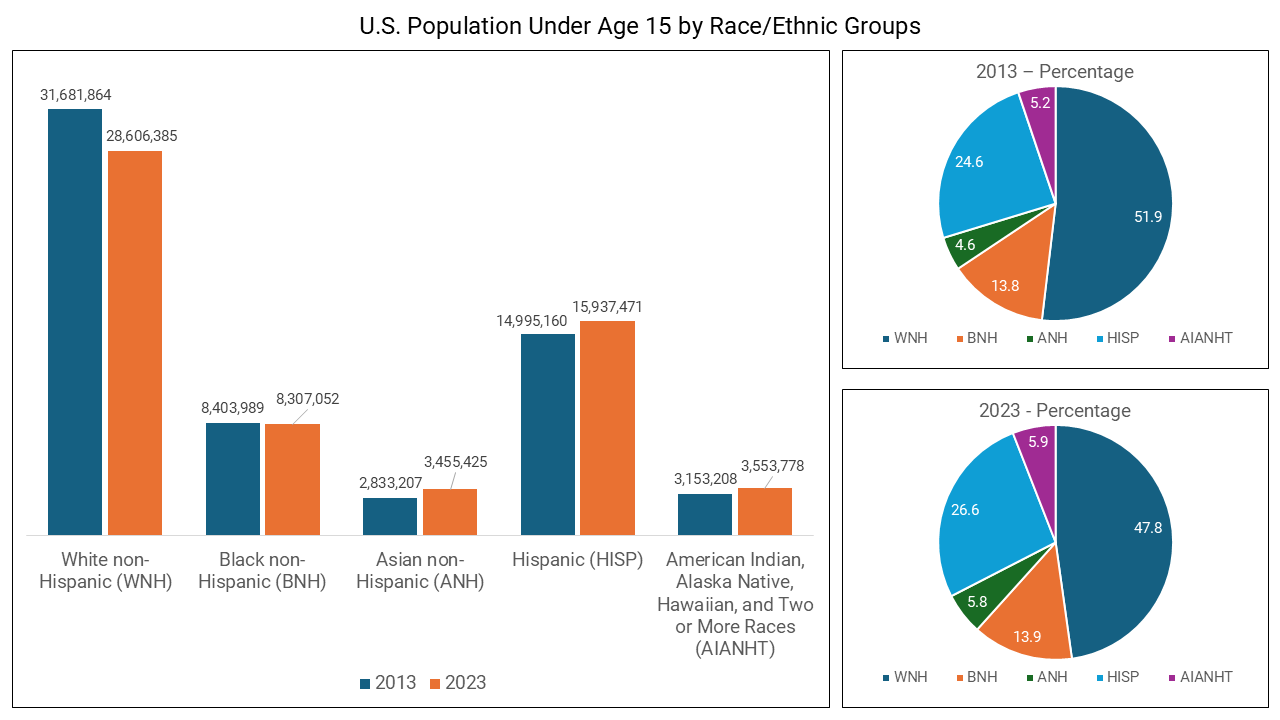
What about the future workforce, or those under the age of 15? The figure below shows that the number of White and Black non-Hispanic populations in this age group decreased between 2013 and 2023 by roughly 3.1 million. The remaining three minority groups increased collectively by roughly 1.9 million, resulting in a net decrease of 1.2 million for this age group. White non-Hispanic under age 15 are a minority, accounting for 47.8% as of 2023. Hispanics accounted for more than one-quarter, or 26.6% in 2023. Similar findings have been documented by the Census.
Source: Author’s Calculations; U.S. Census Bureau Population Estimates
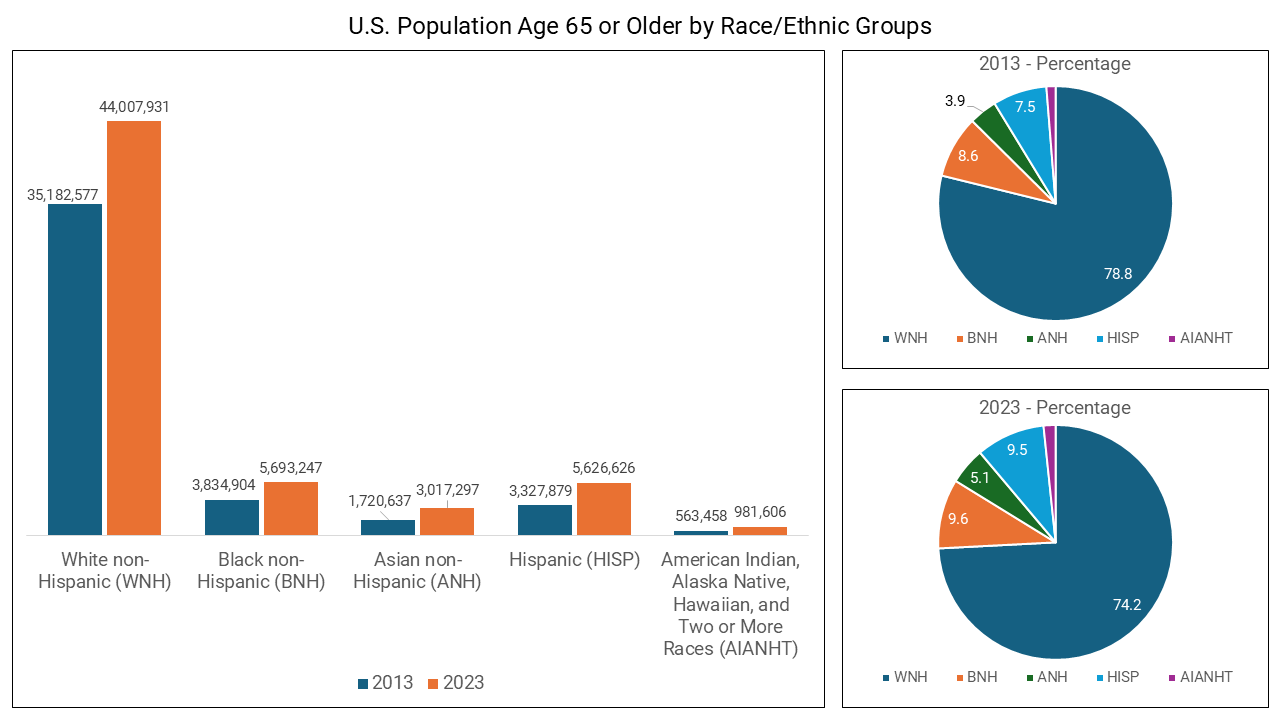
Last but not least, we analyzed those aged 65 or older. This age group increased by 14.7 million between 2013 and 2023, across all races/ethnicities. The largest increase took place among White non-Hispanic, increasing by 8.8 million, followed by Hispanic, with an increase of 2.3 million. As a share of the population in this age group, White non-Hispanic accounted for almost three-quarters or 74.2%. Black non-Hispanic and Hispanic were roughly at 9.5% each as of 2023.
Source: Author’s Calculations; U.S. Census Bureau Population Estimates
Data Whispers
The composition of the working-age population, future pipeline of workers, and those aged 65 or older changed between 2013 and 2023. The working-age and retirement age groups increased during this period, the former thanks entirely to racial/ethnic minorities, and the latter primarily due to White non-Hispanic. However, the future workforce age group (under age 15) declined overall. Even though the share of some minority groups increased in this age group, the decline among White and Black non-Hispanic was larger, resulting in a net loss.
What does this mean? To begin with, an aging (primarily White non-Hispanic) population will place additional stress on communities where the older-younger ratio is increasing. Also, from a public policy perspective, a typically older group of policymakers defines policy that affects more diverse, younger residents. This can result in policy misalignment, differences in prioritization, and generational disconnects.
Data whispers also indicate that if workers are hard to find today, it will worsen in the future, given the decline in the age group of future workers (under age 15). Moreover, Trump’s current immigration policy will also have an impact. If we assume that at least Asian non-Hispanic and Hispanic are strongly correlated with immigration, then the growth in these groups will slow or even decline and with them, the overall growth of both the working-age population (Asian non-Hispanic and Hispanic contributed about 12 million to this age group) as well as the future talent pipeline (Asian non-Hispanic and Hispanic contributed about 1.5 million to this age group).
However, national data can hide important nuances. In the next series of the Data Whisperer, metro, rural adjacent, and rural non-adjacent counties are analyzed using this same methodology to better inform our curious readers.


